
We asked the leading AI models to analyse the current state of AI investment and predict whether the boom will end in a bust. The three leading AI models independently analysed thousands of sources and reached a striking consensus: there’s a better than 7-in-10 chance the AI investment boom will face a significant market correction before 2030, most likely between mid-2026 and early 2028.

Claude 4.5 Sonnet, ChatGPT-5, and Gemini 2.5 Pro each researched the current state of AI investment, compared it to the dotcom bubble, calculated the revenue gap between infrastructure spending and actual returns, and predicted whether, and when, the bubble might burst.
The results are both illuminating and unsettling. All three models concluded that some form of correction is more likely than not, with an average probability of 72% that we’ll see meaningful destruction of capital and valuations. Where they diverged was on severity and timing. Those differences reveal important insights about how different analytical frameworks can weigh the same evidence.
Defining the Bubble: Two Truths Can Coexist
Before examining what the models found, we must clarify what we mean by an “AI bubble.” This isn’t a question about AI’s long-term transformative potential. The technology is extraordinary. Large language models, computer vision, and generative AI are already demonstrating measurable productivity gains across software development, customer service, content creation, and data analysis.
The question isn’t whether AI will change everything. It will. The question is whether current valuations and investment levels reflect the actual revenue being generated and value being captured right now.
Two statements can be simultaneously true:
- AI represents the most significant technological advancement at least since the internet (and maybe ever in the fullness of time) and will eventually justify massive infrastructure investment
- Current spending and valuations significantly exceed demonstrated revenue and near-term monetisation potential, creating conditions for a painful market correction
This was precisely the case with the internet. The technology was genuinely revolutionary. It did transform business and society beyond even the most optimistic late-1990s predictions. Yet the dotcom bubble still burst catastrophically in 2000-2001, wiping out $5 trillion in market value and bankrupting hundreds of companies.
The infrastructure investments that seemed wasteful in 2001: $500 billion invested to deploy 80 million miles of fibre optic cable (85-95% of which remained “dark” (unused) four years after the crash), eventually proved essential. But a brutal correction was still required before demand grew into that capacity. The investors and companies that recognised the mismatch between speculation and reality survived and thrived. Those that didn’t were wiped out.
Why Trust AI Models to Predict Their Own Bubble?
Asking AI to predict whether we’re in an AI bubble might seem paradoxical (and a little meta!) but there’s solid reasoning behind the approach.
Predicting bubbles is notoriously difficult because you’re attempting to forecast crowd behaviour, and the prediction itself will influence the outcome. If enough people think the bubbles, they’ll start behaving like that and the bubble will burst. It’s a reflexive problem where the act of observation changes what’s being observed.
Human analysts face inherent limitations. Even brilliant people close to the industry hold wildly divergent views on AI’s trajectory, making it unclear whom to believe, especially for non-experts. More problematically, the real experts closest to the true numbers are closed-lipped about their metrics and their positions may be biased (intentionally or not) by incentives. Those trying to raise their next funding round to 10x compute (with their dreams of building AGI/ASI and equity stakes to protect), hyperscalers defending massive capital expenditures, VCs supporting portfolio companies, or consultancies selling transformation services all have financial reasons to maintain optimism. Conversely, short sellers, competitive vendors, media outlets and commentators benefit from contrarian scepticism.
I lived through the dotcom bubble. Right up until it burst, people working inside the industry and those covering it in the media continued hyping the potential. We are fundamentally flawed in our ability to be objective predictors, especially when our livelihoods and entire worldview depend on the boom continuing.
AI models offer several analytical advantages over human forecasters in this specific context:
- They can process thousands of sources across the full spectrum from zealous optimists to committed sceptics, synthesising perspectives that individual humans cannot hold simultaneously
- They lack financial incentives tied to the outcome or their own well being (so far anyway … perhaps one day, they too may become subject to such incentives 😉
- They are fundamentally prediction systems trained to identify patterns in data and forecast likely outcomes based on historical precedent
- They can maintain analytical consistency across large volumes of evidence without the confirmation bias that afflicts humans who’ve already staked out a position
This doesn’t mean AI models provide infallible predictions – no such thing exists for complex human systems. But they may offer less biased assessments than most human analysts whose incentives and cognitive limitations skew their judgement.
The Methodology: A Structured Research Process
The experiment proceeded in four stages, with each model working independently using identical prompts (the full prompts used are available here):
Research Phase 1: The Nvidia-OpenAI Deal
Models researched the September 2025 announcement of Nvidia’s $100 billion investment partnership with OpenAI, examining what had been confirmed versus speculation, and surveying perspectives from financial analysts, technology commentators, and industry leaders. This provided a concrete entry point into current bubble dynamics.
Research Phase 2: Historical Comparison
Models conducted deep research comparing the current AI boom to the dotcom bubble, focusing on infrastructure investment scale, revenue generation patterns, market accessibility, adoption velocity, and valuation multiples. This established historical context for pattern recognition.
Research Phase 3: Revenue Gap Analysis
Models calculated the annual cost of operating current AI infrastructure (depreciation, energy, maintenance, staffing) against actual revenue from GenAI inference; deliberately excluding hardware sales, consulting fees, and venture-funded training compute. This quantified the fundamental economic mismatch driving bubble concerns.
Research Phase 4: Scenario Analysis and Predictions
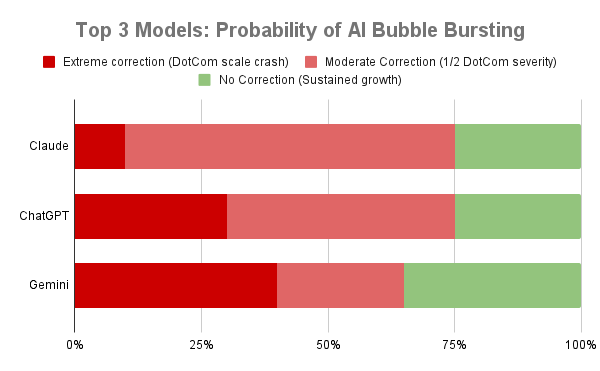
Armed with their research, models evaluated three scenarios: extreme correction (dotcom-scale crash), moderate correction (roughly half the severity), and no correction (sustained growth through 2030). They assigned probabilities, identified likely timing windows, described potential trigger events, and estimated impacts.
The prompts explicitly instructed models to distinguish verifiable facts from speculation, seek credible sources, take a first-principles approach, and define “bubble” as a mismatch between current investment/valuations and demonstrated revenue (independent of long-term potential).
Report 1: The Nvidia-OpenAI Deal – Circular Financing or Strategic Vision?
All three models identified the same fundamental tension in Nvidia’s $100 billion OpenAI commitment: it represents either visionary ecosystem building or dangerous circular financing reminiscent of dotcom-era vendor loans.
Consensus findings across all three:
Nvidia’s partnership with OpenAI, structured as a letter of intent for progressive investment up to $100 billion, involves leasing rather than selling GPUs, with Nvidia receiving non-voting equity at OpenAI’s $500 billion valuation. The deal targets deploying 10 gigawatts of computing capacity, equivalent to 4-5 million next-generation GPUs.
Financial analysts split sharply on interpretation. Bank of America projected 3-5x returns, estimating $300-500 billion in future revenue. But sceptics like Jay Goldberg at Seaport Global Securities characterised it as having “a whiff of circular financing” and “bubble-like behaviour,” comparing it to parents co-signing a mortgage to enable borrowing someone couldn’t otherwise access.
The circular mechanics proved troubling: Nvidia invests in OpenAI → OpenAI leases GPU capacity → lease payments flow back to Nvidia. NewStreet Research calculated that for every $10 billion Nvidia invests, it would generate $35 billion in GPU purchases or leases, representing 27% of Nvidia’s annual revenue.
Where models diverged:
Claude emphasised the concentration of similar patterns across Nvidia’s portfolio: CoreWeave purchased $7.5 billion in Nvidia GPUs partly financed by Nvidia equity stakes, whilst Lambda rents Nvidia chips purchased with debt collateralised by those same GPUs. This systematic circularity exceeded any single deal’s importance.
ChatGPT focused more heavily on explicit warnings from bubble-era veterans like Peter Boockvar, who said the deal had “the names Lucent and Nortel ringing in my ear from the days when they announced similar deals with customers in the late 1990s” (companies whose vendor financing schemes preceded catastrophic collapses).
Gemini provided the most detailed documentation of interconnected investments creating potential contagion risk: OpenAI took a $350 million stake in CoreWeave; Oracle spends $40 billion on Nvidia chips for Stargate datacentres serving OpenAI; Microsoft holds 49% of OpenAI’s for-profit subsidiary. The web of cross-investments amplifies both upside and downside scenarios.
All three models noted that even OpenAI CEO Sam Altman and Meta’s Mark Zuckerberg have recently acknowledged bubble dynamics, with Altman stating “Are we in a phase where investors as a whole are over-excited about AI? My opinion is yes” whilst Zuckerberg admitted a collapse is “definitely a possibility.”
Full reports available here:
Report 2: Dotcom Parallels – History Rhyming at Triple Speed
The historical comparison revealed striking similarities alongside critical differences, with all three models identifying patterns that rhyme with, though don’t precisely repeat, the dotcom era.
Consensus on key similarities:
Infrastructure investment ahead of demonstrated demand characterises both eras. The dotcom bubble saw telecom companies invest $500+ billion (~$1 trillion inflation adjusted) in infrastructure with $120 billion capex in 2000 alone, deploying 80 million miles of fibre, 85-95% of which remained unused four years later. Current AI infrastructure spending will reach $315-392 billion in 2025 alone, with $560 billion having already been invested in the 2023-2024 period.
Revenue-to-investment gaps proved substantial in both periods. In October 1999, 199 internet stocks had a combined market capitalisation of $450 billion against only $21 billion in total sales – a 21.4x multiple. Current AI exhibits a 16:1 investment-to-revenue ratio, with $560 billion invested generating approximately $35 billion in AI-specific revenue.
Extreme valuations disconnected from profitability mark both eras. Dotcom companies traded at 20-50x sales with massive losses. Pets.com for example, spent 233% of revenue on marketing alone. Current AI companies command 30-50x revenue multiples whilst burning billions.
Circular vendor financing patterns echo disturbingly. Lucent extended $8 billion in customer financing, Nortel $1.4 billion, with the top five telecom equipment makers’ commitments exceeding 123% of combined earnings. When customers defaulted (27 of the 30 top publicly traded telecom companies in the dotcom-era were out of business by 2003), vendors faced write-offs of 33-80% of loan portfolios. Nvidia’s $100+ billion in circular investments now approaches or exceeds its annual datacentre revenue.
Critical differences that may prevent dotcom-scale collapse:
All three models emphasised that today’s AI infrastructure boom concentrates amongst profitable tech giants like Microsoft, Amazon, Google, Meta who generate combined revenues exceeding $1 trillion with strong balance sheets capable of absorbing write-downs. Dotcom infrastructure was debt-financed across hundreds of unprofitable startups.
The technology maturity differs fundamentally. The Internet in 2000 remained at 52% US penetration and 6% globally with uncertain commercial applications. AI in 2024 demonstrates proven productivity gains: GitHub Copilot writes 30% of new code, customer service efficiency improvements of 20-35% are meaningful, 78% of organisations use AI in some capacity.
Adoption velocity proves unprecedented. AI reached 78% of organisational adoption in under two years – 60x faster than internet adoption. ChatGPT achieved 100 million users in 2 months versus Instagram’s 10 in 12 months, compressing both opportunity and risk into dramatically shorter timeframes.
Where models differed in emphasis:
Claude’s analysis stressed that current market concentration (the top 10 stocks represent 30-39% of S&P 500 versus 17-27% in 2000) creates unprecedented systemic risk where moderate problems cascade through interconnected positions.
ChatGPT highlighted capital efficiency collapse unique to AI: compute costs scale super-linearly with usage, preventing AI companies from achieving the capital-light, high-margin profiles that made successful SaaS companies extraordinarily profitable once they achieved scale.
Gemini provided the most detailed timeline analysis, noting that the dotcom bubble took 5 years to build (1995-2000) before collapsing, whilst AI has compressed this into 3 years (2022-2025) from ChatGPT’s launch to its current state, suggesting faster dissipation – which could end up either validating investments sooner or trigger corrections more rapidly.
Full reports are available here:
Report 3: The Revenue Gap – A £175 Billion Annual Shortfall
The revenue gap calculation proved the most technically demanding research phase, requiring models to distinguish sustainable inference revenue from bubble-dependent spending and calculate true infrastructure operating costs.
Consensus on infrastructure operating costs:
All three models converged on AI infrastructure requiring 40-50% of capital investment annually to operate – $400-500 million yearly for every $1 billion invested. Against an estimated $500-600 billion deployed infrastructure base, annual operating costs reach $200-250 billion.
The breakdown identified:
- Equipment depreciation: $120-150 billion annually, with GPUs realistically depreciating over 4 years despite optimistic 6-year accounting schedules (no names mentioned …. CoreWeave)
- Energy costs: $36-50 billion annually (with electricity costs in some datacentre-heavy regions increasing 267% over five years)
- Maintenance and repairs: $60-80 billion annually, the largest single cash expense
- Staffing, real estate, networking, software, and administrative overhead: $118-162 billion combined
- Note that debt servicing costs are not included in these cost figures (in CoreWeave’s case, this would add a further 7% to their operating cost ratios)
Consensus on sustainable inference revenue:
Models agreed on GenAI inference revenue of $25-35 billion annually as of mid-2025, deliberately excluding infrastructure spending, hardware sales, consulting fees, and venture-funded training compute:
- OpenAI: $10-12 billion ARR from subscriptions and API access
- Anthropic: $5 billion ARR, up 5x in eight months
- Enterprise GenAI products (GitHub Copilot, Microsoft 365 Copilot, Salesforce AI): $3-5 billion combined
- Cloud provider inference services: $2-4 billion in actual inference revenue, excluding reselling arrangements and double counting AI labs’ revenue
- Other inference applications: $5-7 billion from companies like Midjourney, Perplexity, and various other enterprise platforms
The calculated gap:
This yields a $175-225 billion annual shortfall between infrastructure operating costs and sustainable inference revenue; approximately a 7:1 ratio of costs to revenue.
Claude’s detailed first-principles calculation arrived at a central estimate of £210 billion (cash operating costs) to £345 billion (including depreciation). ChatGPT calculated £180-240 billion. Gemini estimated £160-220 billion. The range reflects different depreciation assumptions and infrastructure utilisation estimates, but all confirmed a massive gap.
The critical distinction:
All three models emphasised that 60-70% of current AI infrastructure spending funds training compute; largely bankrolled by the $192.7 billion in venture capital flowing to AI in 2025. Training spending represents bubble-dependent R&D that would evaporate if funding dries up. Only inference revenue represents sustainable monetisation from actual product usage.
Sequoia Capital’s “$600 billion question” calculation, taking Nvidia’s revenue × 2 for full datacentre costs × 2 for financially sustainable 50% gross margins of the users of the compute, arrives at similar magnitude, identifying that the industry needs over $600 billion in annual revenue to justify infrastructure investments.
Where models diverged:
Claude provided the most granular cost breakdown, including specific calculations for GPU power consumption and maintenance expenses drawn from CoreWeave’s financial disclosures.
ChatGPT emphasised growth trajectory implications most strongly, calculating that inference revenue must reach $100-120 billion by 2026, $200-250 billion by 2027, and $400-450 billion by 2028 to close the gap, requiring sustained doubling every 6-9 months.
Gemini gave the greatest weight to profitability timeline risks, noting that even inference revenue isn’t truly sustainable yet (given that the new breed of thinking models now consume more compute for every output), with OpenAI spending $2.5 billion on inference costs (50% of revenue) whilst targeting 2029 for cash flow positivity.
Full reports are available here:
The Predictions: 72% Probability of Correction
After completing their research, all three models evaluated scenarios and assigned probabilities. The headline finding: an average 72% probability that the AI market will experience a significant correction before 2030.
Probability Assignments
Extreme Correction (dotcom-scale crash):
- Claude: 10%
- ChatGPT: 30%
- Gemini: 40%
- Average: 27%
Moderate Correction (roughly half dotcom severity):
- Claude: 65%
- ChatGPT: 45%
- Gemini: 25%
- Average: 45%
No Significant Correction (sustained growth):
- Claude: 25%
- ChatGPT: 25%
- Gemini: 35%
- Average: 28%
The models reached near-perfect agreement that some form of correction is more likely than not (Claude and ChatGPT both at 75%, Gemini at 65%), but diverged significantly on severity.
Timing Predictions
All three identified mid-2026 through early 2028 as the highest-risk window:
- Claude: H2-2026 to H1-2027 (most concentrated risk)
- ChatGPT: H2-2027 to H1-2028 (slightly later)
- Gemini: H2-2026 to H2-2027 (moderate range)
The convergence on this 18-month period reflects multiple factors aligning:
Goldman Sachs CEO David Solomon’s October 2025 warning of correction “in the next 12 to 24 months” lends support from a respected market timer. This aligns with when AI’s GDP impact must become empirically visible. Goldman projects this visibility will need to arrive “starting 2027” when infrastructure deployment milestones start hitting (e.g. Nvidia-OpenAI’s first gigawatt target of H2 2026).
AI startups that raised $192.7 billion in VC during 2025 face funding pressures in Q3 2026 through Q2 2027 on typical 18-24 month runways. If market sentiment has sours, down rounds and failures will accelerate.
Trigger Mechanisms
Models identified similar cascading events that could initiate correction:
Primary triggers:
- Hyperscaler margin compression as AI revenue growth fails to justify infrastructure costs
- OpenAI or Anthropic significantly missing revenue projections or extending burn timelines
- Enterprise deployment failures becoming undeniable, with major implementations terminated for ROI reasons
Amplification mechanisms:
- GPU pricing collapse as next-generation chips make current fleets obsolete, forcing write-downs on H100 inventories (which have been used by some neoclouds as collateral for debt)
- Circular financing scrutiny intensifying through regulatory inquiries or analyst exposure
- AI startup failures cascade as first-tier companies shut down after exhausting runway
- Utilisation data emerging that documents lower actual usage versus the 90%+ assumed in financial modelling used by infrastructure investors
Impact Projections
Models forecasted substantial, but varied, impacts across their moderate correction scenarios:
Asset value effects:
- Public markets: Nvidia 30-40% decline, Microsoft/Meta/Amazon/Google 20-35% declines, NASDAQ down 25-35%, S&P 500 down 15-20%
- Total public market value destruction: $3-4 trillion (versus $5 trillion in dotcom crash)
- Private AI companies: Tier-1 valuations compress 40-60% (OpenAI from $500 billion to $200-300 billion), tier-2 companies down 60-80% with 30-40% failing entirely
Tech industry employment:
- Direct AI company layoffs: 50,000-100,000 jobs
- Indirect tech sector impact: Additional 100,000-150,000 as enterprise software, cloud providers, consultancies reduce headcount
- Total: 150,000-250,000 job losses over 2026-2027, representing 5-8% of US tech workforce (less extreme than dotcom-era job losses where 200,000 jobs were lost in Silicon Valley alone)
Venture capital impacts:
- AI startup funding falls 70-80% year-over-year, from $192.7 billion (2025) to $40-60 billion (2027)
- 2024-2025 vintage funds face material write-downs, with median returns of -20% to +10% versus typical 15-25% IRR targets
Where Models Diverged Most
The split on extreme versus moderate correction probability reveals different analytical frameworks:
Claude’s conservative 10% catastrophic probability reflected emphasis on protective factors: hyperscalers’ $460 billion cash reserves and sustainable underlying businesses, tech sector forward P/E of 30.4x sitting 45% below 2000’s 55.5x peak, and genuine commercial traction with measurable productivity gains.
ChatGPT’s 30% extreme probability weighted dotcom precedent more heavily, noting parallels in circular financing patterns and vendor behaviour despite acknowledging differences in funding sources.
Gemini’s 40% catastrophic probability emphasised concentration risk most strongly and expressed greatest scepticism about whether hyperscaler profitability could withstand extreme correction without triggering broader systemic collapse.
All three assigned similar 25-35% probability to no-correction scenarios, requiring inference revenue to sustain 100%+ annual growth through 2027-2028, enterprise AI moving from pilots to production at scale with 40-50% success rates by 2027, and GDP impact becoming empirically demonstrable in productivity statistics.
Full reports are available here:
A Critical Assessment: The Rationality Paradox
The models have performed admirably (in my view), synthesising vast amounts of conflicting information into coherent probabilistic frameworks. However, I believe they’ve made one critical error: over-weighting the moderate correction scenario – perhaps precisely because they’re rational analytical systems attempting to predict likely outcomes based on data, as opposed to humans’ irrational response to that data.
Bubbles, by definition, are examples of humans behaving irrationally in concert. The self-reinforcing dynamics that inflate bubbles (everyone investing because everyone else is investing) operate through collective psychology, not rational calculation of fundamentals.
When bubbles burst, the same herd behaviour operates in reverse. Irrational exuberance gives way to irrational fear. The pendulum doesn’t gently return to equilibrium. It over-swings in the opposite direction.
History demonstrates this pattern repeatedly. The dotcom crash didn’t result in the NASDAQ declining 30-40% from its peak. It fell 78%, obliterating $5 trillion in value. The 2008 financial crisis didn’t produce orderly deleveraging. Major investment banks collapsed overnight. The COVID market panic saw circuit breakers triggered repeatedly as algorithmic selling reinforced human panic.
If the AI bubble bursts (which remains uncertain but in the models’ view probable) the correction is more likely to be extreme than moderate. Markets don’t half-crash. They crash, overshoot, then gradually recover as rationality returns.
The models’ 27% average probability for extreme correction and 45% for moderate correction should likely be reversed: 40-50% extreme, 20-30% moderate (if a correction does indeed occur).
This isn’t a criticism of the models’ analytical capabilities. It’s recognition that rational systems struggle to model irrational dynamics. The very qualities that make AI models excellent researchers (processing vast data, maintaining analytical consistency, avoiding emotional bias) limit their ability to forecast herd behaviour and panic cascades.
Preparing for Uncertainty: Risk Management in Bubble Conditions
Whether we’re in a bubble matters enormously for practical decision-making for companies, investors, and individuals whose livelihoods depend on the technology sector.
I lived through the dotcom era. I lost my job at a dotcom company in a way that I felt was very unexpected at the time, but in retrospect, I now realise was entirely predictable had I not been one of the bubble’s cheerleaders. I watched how the few companies that were prudently prepared (those that had conserved capital rather than spending lavishly, prioritised revenue over future potential and maintained operational discipline) benefited greatly when the bubble burst. They acquired competitors’ assets at fire-sale prices, hired talented people suddenly available for much reduced salaries, and emerged stronger into a growing market with fewer competitors.
Most startups (including the one I worked at) were wiped out overnight when their funding dried up. Public company valuations collapsed even for those with sustainable businesses. Investors who recognised the mismatch between valuations and fundamentals and reduced exposure before the crash made a killing by preserving capital and buying back in at the bottom (e.g. Amazon lost 90% of its value but has since appreciated 500+ from its post-bubble lows). Those who stayed fully invested suffered catastrophic losses.
This is fundamentally about risk management and preparation. As my first boss used to say… (actually he didn’t and that’s why we went bust ;), rather what he should have said is, “Hope for the best. Prepare for the worst.”
Prudent risk management requires companies to (and this might sound obvious, but it’s worth repeating since it seems to be fully out of fashion in the winner-takes-all, first-mover era):
- Maintain reserves for expected losses based on probability of adverse events
- Hold capital to withstand unexpected losses exceeding those reserves
- Calculate required buffers by understanding both the probability and magnitude of potential impacts
It’s impossible to make these calculations without an honest assessment of bubble probability and correction severity.
The prudent approach favours conservative overhead structures over just-in-time funding when funding appetite can change overnight. Build 18-24 month runways, not 6-12-month runways. Prioritise the path to profitability over growth at any cost. Pursue revenue traction rather than relying on valuation momentum. Indeed, the companies that can demonstrate strong revenue traction can position themselves to be the winner-takes-all player in a constrained funding environment.
Regrettably, few companies operate this way during bubble conditions. The pressure to match competitors’ spending, the availability of cheap capital, and the narrative that “this time is different” overwhelm conservative instincts and “establishment” good-business practices.
For investors, the calculus is equally clear but difficult to execute: still be in, but reduce exposure to, unprofitable high-potential AI pure-plays that have very high burn rates that depend on ongoing funding to validate their business models, favour companies with demonstrable revenue growth from real buyers (not from demand manufactured by circular economics whose origin is VC money in the first place), maintain higher cash positions than normal, and prepare capital for post-correction deployment – both to save solid portfolio companies and pick up post-correction bargains from investors who can’t afford to do so.
My Personal Position: Underhyped Long-Term, Overhyped Short-Term
I should state my bias explicitly: I’m a huge believer in AI’s long-term transformative potential. I believe it’s underhyped for what it will accomplish over the next 10-20 years. I believe that the technology will eventually exceed even the most optimistic mainstream predictions about its economic impact.
I also believe it’s overhyped in the short term. Current valuations and spending levels significantly exceed demonstrated revenue and near-term monetisation potential. For the bubble to burst, it doesn’t matter whether $1 of thinking tokens deliver more value to a buyer than $1 of single shot tokens – or than $1 of SaaS spend for that matter. All that matters is whether the companies delivering those tokens can afford to continue doing so.
There are two ways they can: a) they earn enough from selling tokens; or b) investors continue to fund them to sell them at a loss. Since most tokens are currently delivered at a loss, if investor sentiment cools before that changes, the bubble will burst.
This mismatch creates correction risk regardless of long-term potential. Both things can be – and likely are – true simultaneously.
I want to be on the right side of this divergence. I want to help others be positioned correctly as well.
This means taking seriously the bubble probability whilst remaining bullish on the technology. It means preparing for the worst whilst hoping for the best. It means distinguishing between “this technology will change everything” (true) and “current valuations are justified by near-term fundamentals” (questionable).
The companies, investors and workers who navigate this distinction successfully will be those who thrive through the transition, regardless of whether correction materialises.
Introducing Bubble Watch: Monthly Probability Updates
This analysis represents a point-in-time assessment based on available evidence through up to 7 October 2025. But bubble dynamics are fluid. Every month brings new data that informs probabilities and adjusts forecasts.
Therefore, we’re launching ‘Bubble Watch’ – a monthly update published on the first Tuesday of each month where we’ll feed updated information into each model and ask them to reassess their predictions in light of recent developments.
We’ll report those updated probabilities here, tracking how the models adjust their forecasts as events unfold. Do extreme correction probabilities increase as revenue growth disappoints? Do no-correction probabilities rise if sustainable inference revenue accelerates and delivers measurable enterprise value? How do the models update their timing windows as we approach the highest-risk periods?
AI is now in the “put-up or shut-up phase” of its development. The infrastructure investment will continue into the foreseeable future. We must now see revenues catch up in the not-too-distant future. With every month they don’t, the extreme correction probability should increase, and we’ll be tracking whether the models recognise and reflect this.
The next update will be produced on Tuesday 4th November and assess developments through the month of October 2025, with particular focus on Q4 earnings guidance from hyperscalers, any changes to infrastructure deployment timelines, and updates to OpenAI and Anthropic revenue figures.
This is a moving target. The only certainty is uncertainty and the emotions of the crowd. But by systematically tracking how expert AI systems evaluate evolving evidence, we can maintain clearer perspective than the binary extremes of uncritical enthusiasm or reflexive scepticism that dominate much current discourse.
The bubble question isn’t whether AI is transformative. It is. The question is whether current capital allocation appropriately reflects near-term revenue reality. And that question deserves rigorous, updated, evidence-based analysis.
We’ll be watching the bubble. Together with its creations.
The full methodology, prompts, and detailed research reports from all three models are available in a single document at this link. To access the complete scenario analyses and probability calculations, I thoroughly recommend reading Claude’s and Gemini’s full reports. And perhaps there’s a fitting irony in this entire exercise: the same infrastructure investment boom that created the bubble also generated the research focus, capital, and compute power necessary to build the very AI systems we’ve now used to analyse and predict that bubble’s potential correction.